

September is prime time for scholarship launches. But once the application is live, your job isn’t done; it’s just beginning. The first month provides a goldmine of data to help you adjust course, improve outreach, and ensure your program doesn’t fall flat.
Here’s what to track in those critical first 30 days.
Start Rate vs. Completion Rate
If 500 people start your application but only 50 finish it, something’s wrong, and early data can help you fix it.
Keep an eye on:
- Where applicants drop off
- How long it takes them to complete key sections
- Whether required uploads or essay prompts are causing friction
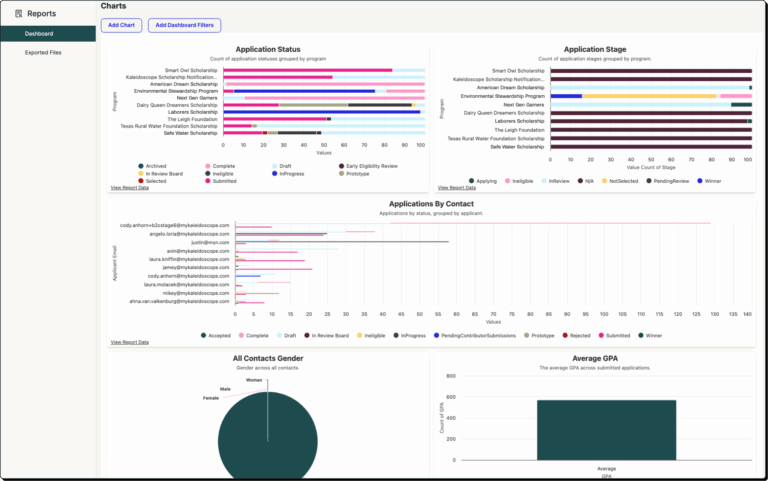
Kaleidoscope’s real-time dashboards make it easy to spot (and address) drop-off trends without digging through spreadsheets.
Are You Reaching the Right People?
It’s not just about quantity; it’s about who is applying. Early demographic breakdowns can tell you whether your scholarship is attracting your intended audience.
Notice a gap in applicants from rural areas? Or underrepresentation from a target group? These signals can prompt a quick pivot: re-share with regional schools, engage relevant orgs, or amplify student voices who reflect your goals.
Bounce Rate and Traffic Sources
Understanding how people arrive at your application, and what they do once they get there, is key.
For example:
- A high bounce rate from email traffic might mean your landing page isn’t clear or compelling enough.
- If Instagram swipe-ups are outperforming LinkedIn ads, that tells you where to reinvest budget.
- A spike in direct traffic could point to earned media or word-of-mouth working well.
Not all traffic is equal. Watch what converts.
Use Tools That Do the Heavy Lifting
No need to drown in data. Stick to essentials:
- Google Analytics (GA4) shows who’s visiting and where they’re coming from.
- Scholarship platforms (like Kaleidoscope) give a live look at completions, drop-offs, and demographics.
- UTM tags help attribute traffic to specific campaigns or partners.
Bonus tip: Set up a weekly metrics check-in with your team, short, focused, and action-oriented.
Metrics Are Fuel, Not a Report Card
Don’t wait until the cycle ends to realize what could’ve gone better. The smartest scholarship providers adjust mid-flight, using real-time signals to guide decisions.
Whether you’re optimizing copy, adjusting timelines, or increasing reach, data from the first 30 days can make the difference between a mediocre cycle and one that meets (or exceeds) your goals.
Want a simpler way to track everything in one place? Kaleidoscope helps you monitor applications, uncover trends, and connect insights to action, no micromanaging required.
Let’s build a smarter scholarship cycle, together.
Resources for sponsors


Read more

Read more

Read more

Read more


Read more

Read more

Read more